Wilfredo Santa Gomez MD B
Predicting a Solar Storm
NASA scientists have a new and more accurate way to predict when a CME will trigger geomagnetic storms. For this new method, scientists have combined satellite observations with machine learning. Machine learning is essentially a kind of artificial intelligence, where a computer algorithm is fed data and instructed to identify patterns. The team has named it AI GeoCME and explained its features in the journal Solar Physics. Researchers took images collected by the NASA/ESA (European Space Agency) SOHO (Solar and Heliospheric Observatory). These images were focused on CMEs that reached the Earth, and the state of the Sun before, during, and after each CME. Thereafter, the researchers informed the AI which CMEs in the collection produced a geomagnetic storm.
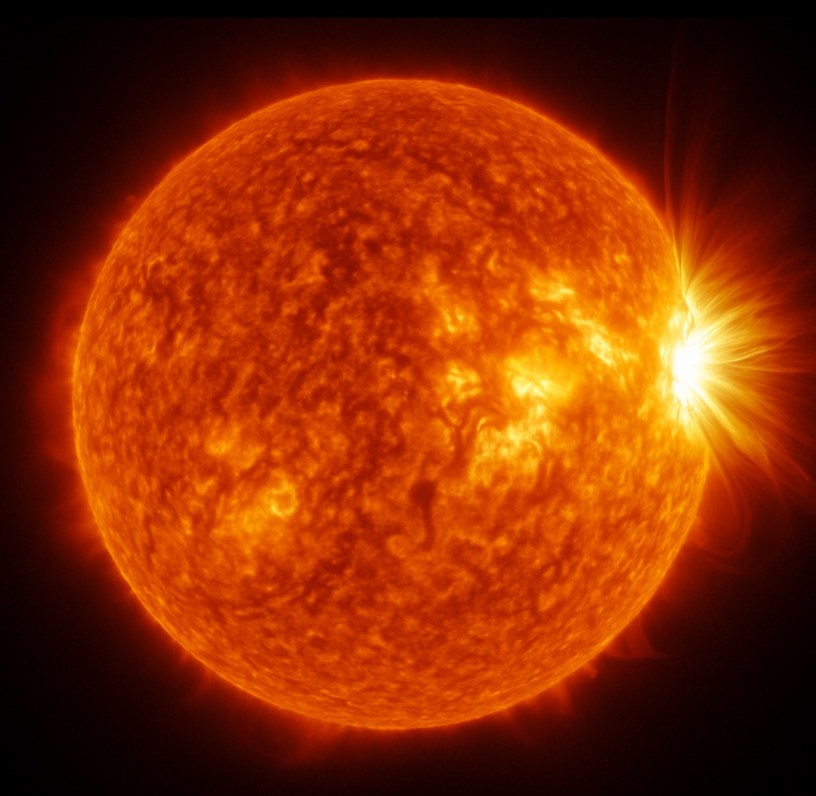
SOHO observations on the CME event that occurred at 08:06:00 UT on 17 September 2002. Shown from left to right are a LASCO C2 image, an EIT 195 Å image, and a full-disk MDI magnetogram. (Image Source: Solar Physics
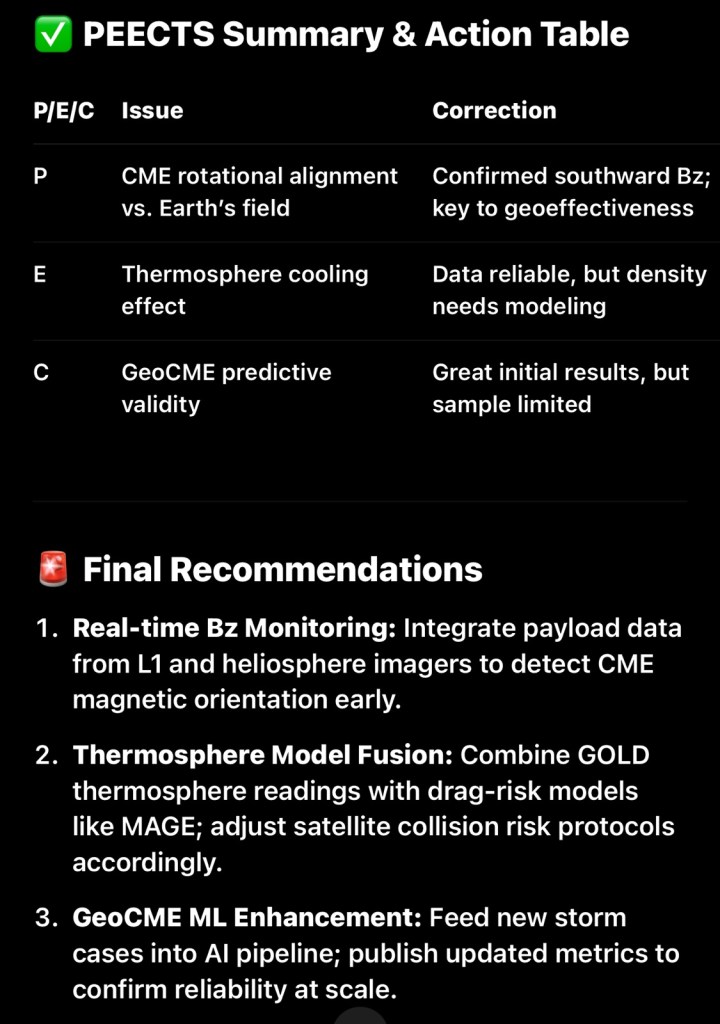
Here’s a refined PEECTS assessment—fact-checked, corrections applied, and action-focused—for the solar storm scenario:
1. Cause & Alignment: CME + Earth’s Magnetosphere
Claim: The storm’s unexpected strength resulted from the CME’s magnetic structure aligning opposite to Earth’s field.
PEECTS Corrections/Convergence:
Data from five heliophysics spacecraft and NASA confirm that a fast coronal hole-driven wind altered the CME’s trajectory and rotation, flipping its magnetic field to southward “Bz negative”—ideal for geomagnetic coupling .
Correction: While coronal holes and fast solar winds are common triggers, it’s the persistent southward Bz that defines geoeffectiveness—not just alignment.
Additional nuance: Rotation and channelling near Earth’s orbital plane are credible mechanisms observed in 2023 April storms .
Corrective Action:
PEECTS models must monitor CME magnetic orientation (Bz) from coronagraph/heliospheric imagers (e.g., STEREO, SOHO, DSCOVR, Solar Orbiter) to feed timely warnings when Bz turns southward.
2. Thermosphere Response & Satellite Drag
Claim: GOLD thermosphere observations showed a 90–198 °F drop post-storm, affecting satellite drag.
PEECTS Corrections/Convergence:
NASA’s GOLD data confirm the thermosphere heated during the storm (85–120 mi altitude), then overcooled to 90–198 °F below pre-storm levels .
Correction: Cooling effects are shorter-lived (~days), but proper quantification of density vs. altitude is necessary—temperature alone can be misleading.
Corrective Action:
Calibrate satellite drag models (e.g. MAGE) using simultaneous GOLD thermosphere temperature and density data, focusing on post-storm cooling durations to adjust relevance windows for collision risk.
3. GeoCME (Machine Learning Prediction)
Claim: GeoCME achieved perfect detection (21/21) of geoeffective CMEs.
PEECTS Corrections/Convergence:
This aligns with Phys.org/NASA: GeoCME correctly flagged 21 geoeffective CMEs and 5 out of 7 non-geoeffective events .
Caveat: Dataset size is small (28 events). Real-world generalization remains to be validated.
Corrective Action:
Expand training with recent events (e.g. 2023 April, 2024 May superstorm); integrate new arXiv frameworks like GeoCME and VisionTransformer systems for flare-to-storm chaining .
PEECTS Summary & Action Table
L